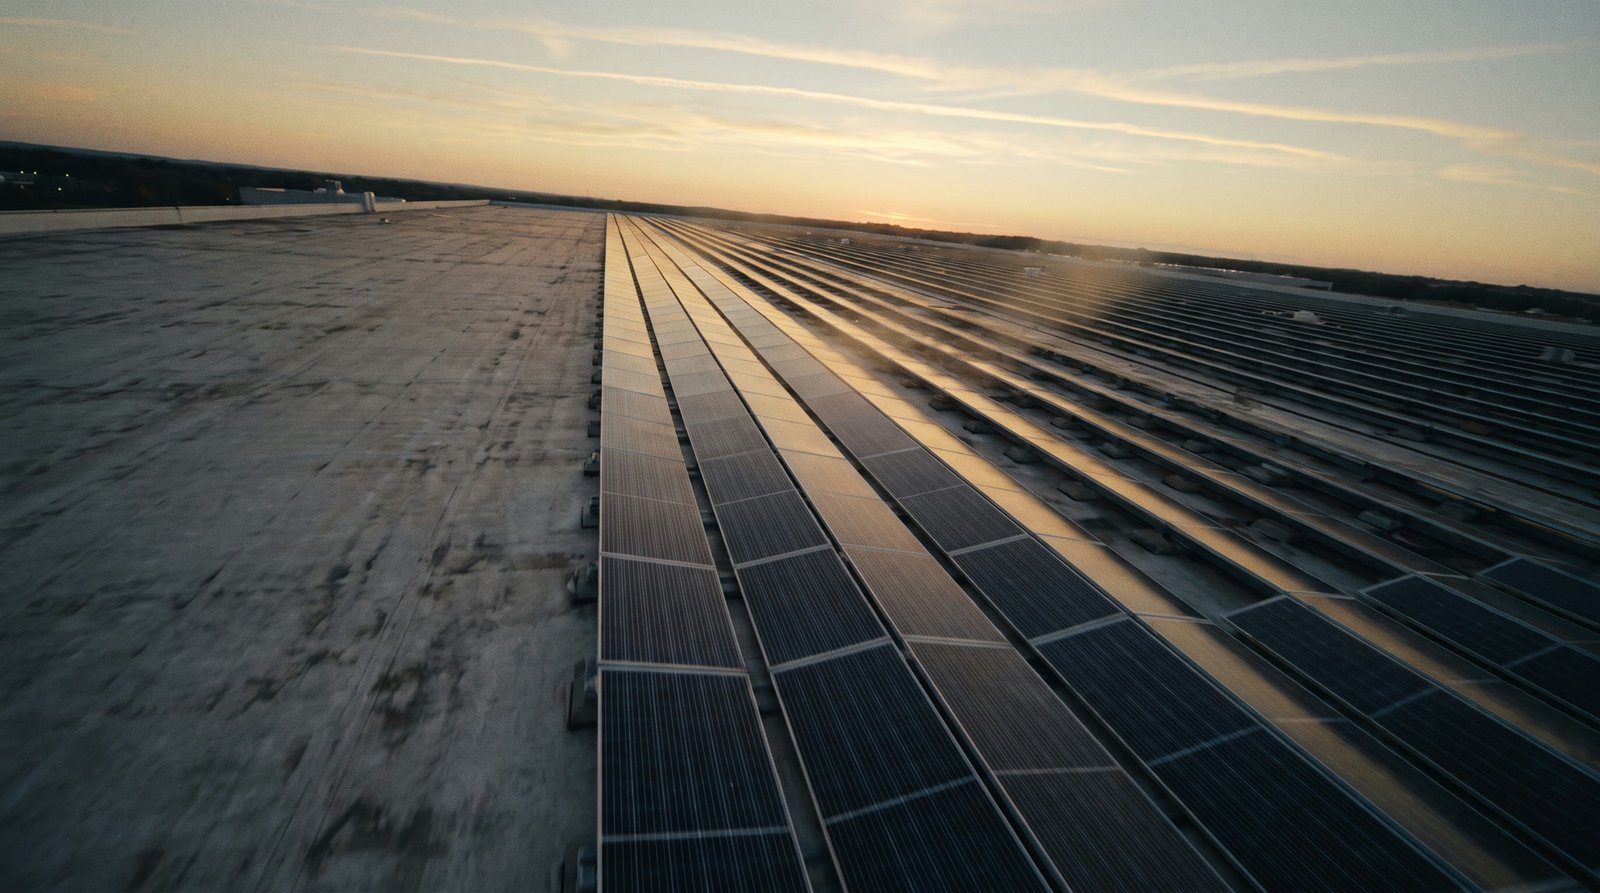
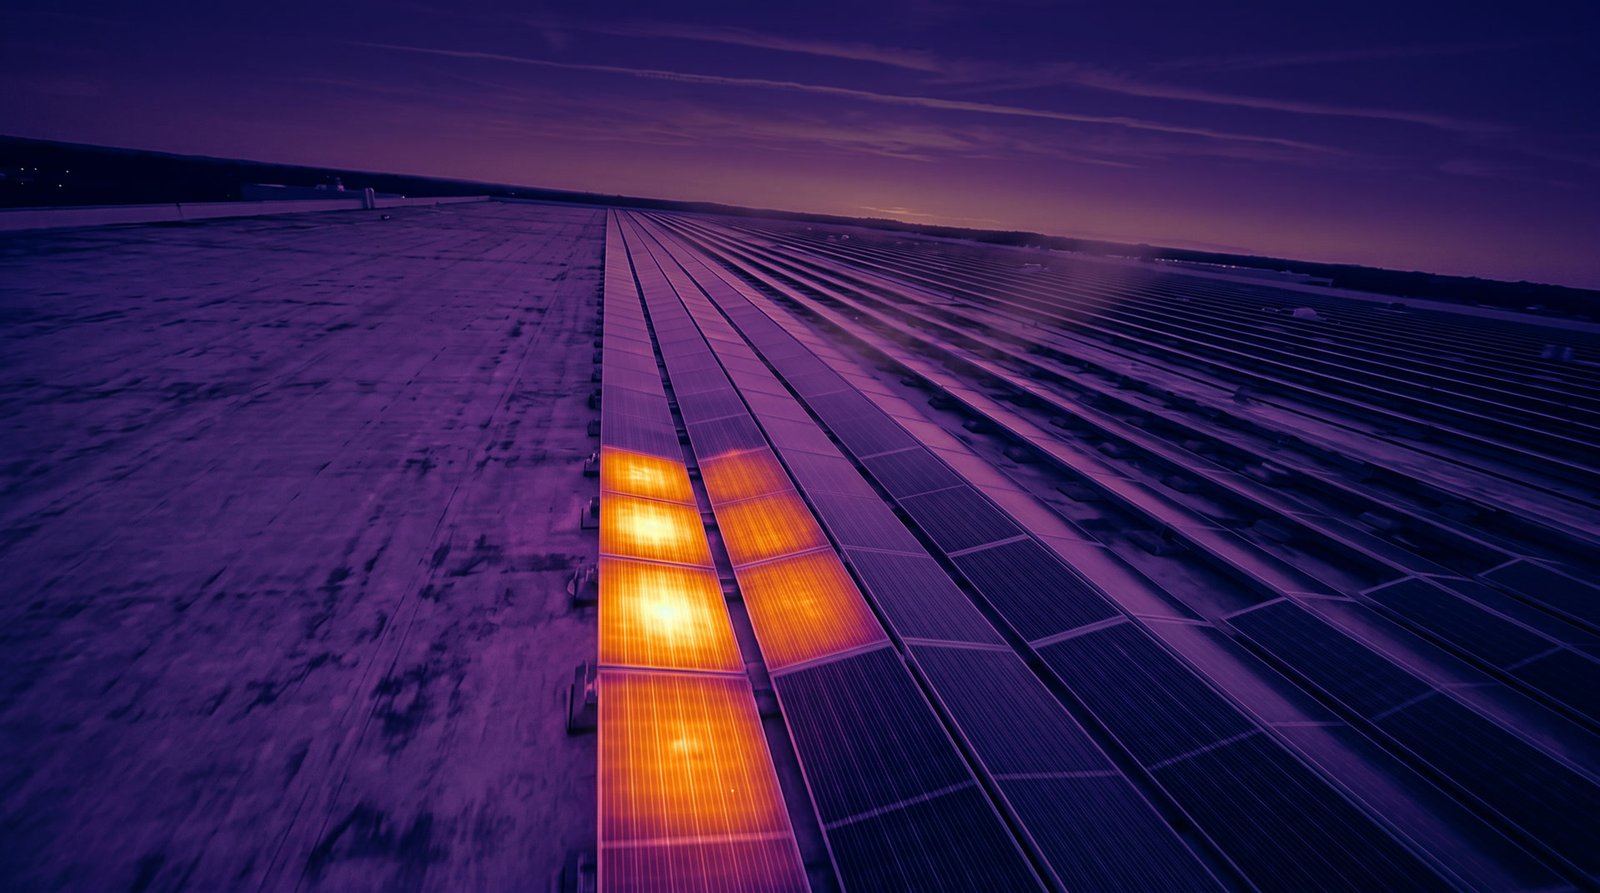
Most solar problems don't look like anything. A blown fuse. A failing connector. A cracked cell. From the ground the array looks fine, and your production report just says something, somewhere, is down.
Not every warm spot is a failure. Each finding is a place to look closer, with its location on record.
HOT SPOT · ROW 12, PANEL 214STRING OFFLINE · ROW 9SOILING · SOUTH EDGEThree findings the eye would miss.
What we do
Commercial solar thermal inspection. Nothing else.
THERMALVISUALDRAG TO SCAN
Specialists beat generalists at finding faults.
A thermal drone pass over your installation captures aerial heat data on every panel. You get the anomalies, their locations, and a report built for follow-up.
Thermal and visual aerial capture
Anomalies identified and located
Reporting your O&M team can work from
How it works
Four steps. One flight.
01
Schedule
Tell us about the site. We confirm scope, timing, and flight conditions.
02
Fly & Capture
The drone flies the array in a planned grid, capturing thermal and visual imagery of every panel.
03
Analyze
Every frame gets reviewed. Thermal anomalies are identified, located, and classified.
04
Receive Your Report
A clear document: findings, locations, severity, and suggested next steps.
No handoffs. The pilot who flies your site is the analyst who reads the data and writes your report.
The flagship service
What a thermal inspection gives you.
01Thermal aerial imagery of the full array
02Thermal anomalies identified and classified
03Side-by-side visual and thermal comparison
04Exact location of every finding
05A professional inspection report
06Findings organized so follow-up is simple
What the scan can find
Every fault has a heat signature.
A thermal camera doesn't see problems by name. It sees patterns, and reading them is the skill. This is the catalog behind every Solentra flight, ordered by how much production is on the line.
01Module level
Faults inside individual panels.
Small on their own, easy to miss from the ground, and the earliest warning the array gives you.
Hot cell
Junction box
Bypass diode
Overheating RSDs
Warm module
Missing module
PID
Cracking
Soiling
Delamination
Weather damage
02Obstructions
Nothing broken, production lost anyway.
Something sits between the sun and the glass. Cheap to fix, expensive to ignore.
Vegetation
Shading
Physical objects
03String level
The most severe, and the easiest to catch from the air.
Whole groups of panels down at once: one fault, hundreds of modules, and it can sit invisible in a monthly production report.
Offline string
Underperforming string
Circuit
Reverse polarity
Inverter
Combiner
Every frame we capture carries survey-grade GPS metadata from the drone's RTK module, so a finding is never "somewhere on the roof." It's a row and a panel, traced against your string layout.
String-level faults are why inspections pay for themselves: one offline string can quietly outweigh every other finding on the roof combined. The sample report below shows exactly that.
Industry standards
How often should an array be scanned?
The industry's answer is written down. IEC 62446-3 defines outdoor thermal inspection of operating PV plants, and the accepted cadence is simple: scan every year, and scan again when something changes. Many insurers now expect the annual thermal record.
At commissioning
A baseline scan of the new array. Every future inspection is compared against it.
Every year
The annual thermal scan, following IEC 62446-3 practice. The record many insurers ask to see.
THE STANDARD
Every 6 months
For harsh sites: coastal salt, heavy dust, nearby industry, or systems past their fifth year.
After severe weather
Hail can cut output while the glass looks perfect. Micro-cracks show up in infrared, not from the parking lot.
Before warranty expiry
Find covered defects while they're still the manufacturer's problem.
Cadence guidance reflects IEC 62446-3 practice and common insurer expectations. Site conditions, insurers, and equipment warranties may set their own terms.
Why Solentra
Solar knowledge behind the lens.
PV knowledge plus thermal technology. Behind the lens: a PV Associate credential and a purpose-built thermal drone. A thermal image of a solar array is only as good as the reading, and knowing how PV systems work is what turns pixels into findings.
Solar-only focus
Thermal inspection built around PV, not generic drone photography.
Survey-grade locations
RTK-tagged frames put every finding on a row and a panel, not a guess.
Commercial-focused
Sized for large rooftops and installations.
Professional reporting
Findings tied to locations and imagery, so nothing rests on our say-so.
Who we serve
Built for the people responsible.
Solar O&M Companies
Aerial thermal coverage for your maintenance program, without adding headcount.
Solar Installers
Commissioning checks and warranty documentation for the systems you build.
Commercial Solar Owners
Know what your installation is doing, beyond the monitoring dashboard.
Property Managers
Know the condition of every array across your portfolio.
Notes: Localized temperature rise at panel center under uniform sun. Pattern consistent with a possible cell-level defect. Recommend electrical verification by your service provider.
From findings to dollars.
SAMPLE FIGURES
The report doesn't stop at "we found 47 anomalies." It estimates what each finding class costs in production every year it goes unaddressed. Here's that summary from an example inspection:
Finding class
Anomalies
Modules
Est. affected DC
Est. annual impact
Cell-level hot spots
10
10
1.16 kW
2,310 kWh · $525
Bypass diodes
21
21
2.20 kW
4,410 kWh · $1,102
String-level faults
16
304
95.76 kW
191,520 kWh · $47,880
Total
47
335
99.12 kW · 1.83%
198,240 kWh · $49,507
Sixteen string faults out of 47 findings, and 97% of the cost. That's the severity ladder from the catalog above, in dollars.
Illustrative figures for an example commercial array, rounded. Your report estimates impact from your system's own capacity, layout, and rates.
Reports flag anomalies for further investigation. Diagnosis and repair remain with your electrical or O&M contractor.
Referral program
You see the roofs. We see the heat.
Roofers, installers, O&M crews, property managers: you stand on commercial roofs every week. When you spot a solar array that's never had a thermal inspection, that's a referral, and we pay for it.
Generate your code. Takes ten seconds. The code is yours alone, so every job it brings gets credited to you.
Pass it along. Give it to the building owner or manager. The code gets them 10% off their first inspection, so you're doing them a favor, not selling.
Get rewarded. When their inspection is completed, you choose: $100 per referral, or 15% off your next service.
Rewards are paid once the referred inspection is completed and invoiced. One reward per referred property. Your code identifies you, so share it as yours alone.
Your referral code
Questions
Asked before every first flight.
Temperature differences. Hot spots, cool panels, offline strings. Each is an anomaly to investigate, not an automatic diagnosis.
Commercial rooftop and ground-mounted installations. Large arrays are the specialty, and that's exactly where climbing around with a handheld camera stops making sense.
No. Solentra inspects, analyzes, and reports. Repairs stay with your electrician, installer, or O&M provider, and our report gives them exact locations to start from.
Thermal and visual imagery, each anomaly's location and classification, side-by-side comparisons, notes, and a suggested next step per finding.
Flight time for a typical commercial array is measured in minutes, not days. Analysis and reporting follow within a few business days.
Yes. That's the point of the drone: rapid aerial coverage of installations that would take days to walk.
New Jersey.
A visual inspection sees what light shows: broken glass, debris, soiling. A thermal inspection sees heat, which is where electrical problems show up first. Many faults are invisible in daylight and obvious in infrared.